
Brazil - Regional disparities
Economic development and nature conservation
978-3-14-100890-6 | Page 196 | Ill. 1
Overview
The map composition "Regional disparities" for the federal states of Brazil is one of 5 such map displays in the atlas - the other being the British Isles (UK & Ireland, see 83.4), Russia and its neighbours (see 114.2), India (see 123.6) and China (see 126.1). The purpose of these map compositions is to establish a sub-national country profile based on a set of similar statistical indicators (such as population development within the last 10 years, gross domestic product, both per capita as well as over time). It is thus possible to compare the subsequent regional patterns of a common statistical indicator among the aforementioned set of countries.
Economic and demographic disparities
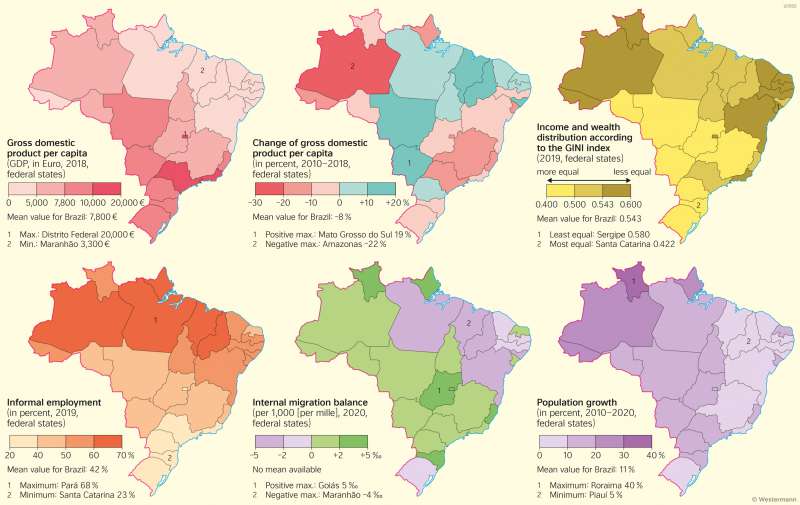
The subnational country profile for Brazil introduces some very interesting statistical perspectives on the country and its regions (for names of Brazilian states confer page 192/193), which were not included yet in other country profiles of the atlas. New are: the GINI index, informal employment and internal migration balance.
However, the first two maps feature again gross domestic product per capita (2018) as well its change between 2010 and 2018. While the first map clearly underlines the division of Brazil into a rich South along the Atlantic coast (with the populated and industrialised states of São Paulo and Rio de Janeiro as frontrunners),a similarly rich Southwest with the two heavily agriculturalised Mato Grosso states, and a poor Amazonia and even more poor Northeast with the famous semi-desert Sertão in its centre. The change in GDP per capita 2010-2018 shows a very different pattern, a three-tier diagonal division of Brazil running Southwest to Northeast: First, the Atlantic Coast up until Recife with losses in GDP per capita due to the strong recession between 2014 and 2017 and the subsequent devaluation of the Brazilian Real; second the central strip with gains in GDP per capita and third the Amazon basin with again signficant GDP per capita losses. It is interesting to note that some of the poor northeastern states experienced a strong surge of GDP per capita while the economic powerhouse São Paulo, accounting for a third of the total Brazilian GDP, experienced a loss in GDP per capita of -13%!
The next map shows the GINI index which is a measure for inequality of income or wealth - the higher the index (between 0 and 1.0), the less equal income and wealth are distributed among the population (meaning that few own much and many own little). The regional pattern for Brazil mirrors that of GDP per capita distribution, only that the two most important states, São Paulo and especially Rio de Janeiro, exhibit more unequality than anywhere in the South of Brazil.
The fourth map shows informal employment which is strong (over 50%) in the rather poorer, rather less developed Amazonia and Northeast (Sertão) and weak in the highly developed, southern states (under 40%).
The internal migration balance is negative in the Northeast except two small states with migration gains, as well as in the Eastern Amazon state of Pará and surprisingly in the southernmost state of Rio Grande do Sul. The balance is strongly positive in and around Brasília, in the southern state of Santa Catarina and in the Atlantic coast state of Espírito Santo northeast of Rio de Janeiro.
Population growth between 2010 and 2018 has been strong in the Amazon basin streching into most of the country except the poor Northeast, Minas Gerais, Rio de Janeiro and the southernmost state of Rio Grande do Sul, where population growth was still positive between 2010 and 2020 but below the Brazilian average of 11%.